In this post, i would like to show you a method called “Carrying capacity” by Parques Nacionales that we use to decrease the enviromental impact on routes. This is useful for people who want to create a tourism route or for those who want to understand the importance of respecting the routes, along with advice fo hiking or traveling a route.
What is carrying capacity?
The carrying capacity of a route refers to the maximum number of people who can use the route simultaneously without causing significant negative environmental impact, without degrading the users’ experience, and without exceeding the available infrastructure and resources.
To define the carrying capacity of a route, several factors must be considered:
Environmental Impact: This includes soil erosion, disturbance of local flora and fauna, and waste management. A high density of visitors can cause significant damage in these aspects.
Visitor Experience: Overcrowding on a route can deteriorate the visitor’s experience, due to congestion, noise, and a reduced ability to enjoy the environment in peace and tranquility.
Infrastructure and Services: The capacity of paths, signage, sanitary facilities, and emergency services to handle a certain number of people without becoming overwhelmed.
Safety: Considerations on how the number of people can affect the overall safety of the route, including risks of accidents or incidents.
1. What should we measure for the carrying capacity of a route?
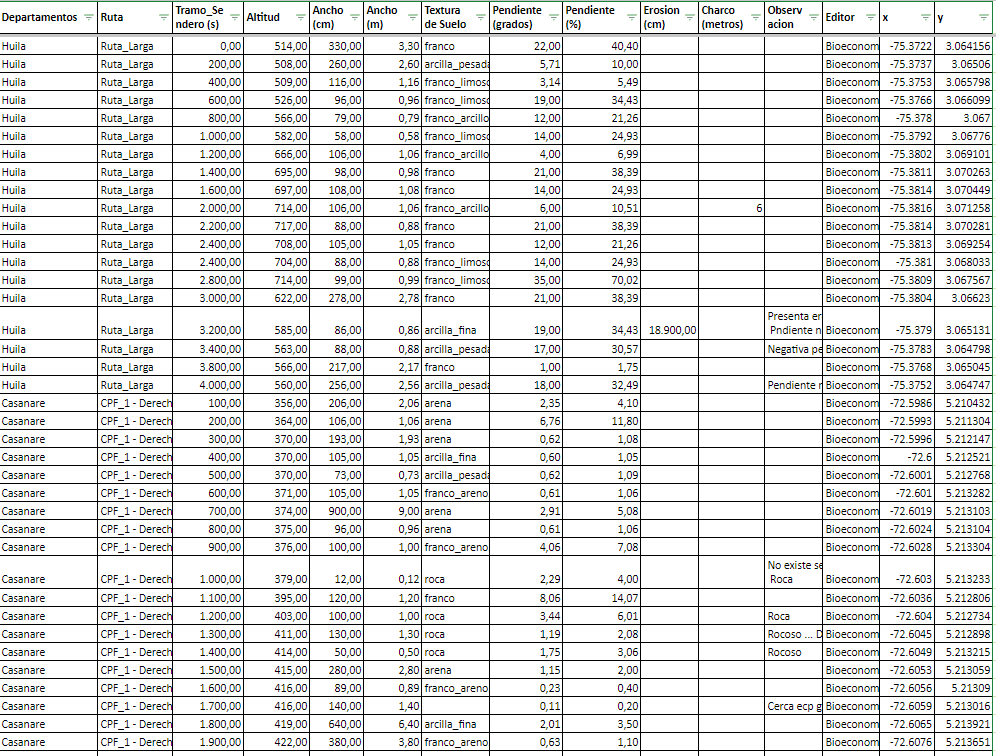
There are three types of carrying capacity, Physical Carrying Capacity (PCC), Real Carrying Capacity (RCC) and Effective Carrying Capacity (ECC) . To measure the carrying capacity of a trail, it is necessary to measure field variables related to the current state of the trail, considering a measurement every 100 or 200 meters. The following are the variables to be measured.
| Variables | Measure | Tools |
|---|---|---|
| Hours open to public | Hours ⏱️ | Your own data |
| Months open to public | Months 🗓️ | Your own data |
| Minimum distance between groups | Meters 📏 | Your own data |
| Number of people for each group | Number 🧑👩🦱 | |Your own data |
| Total distance | Meters 📏 | GPS |
| Travel time | Hours ⏱ | GPS |
| Altitute | M.s.n.m 💧 | GPS/Altimeter |
| Trail Width | Centimeters (cm) 📏 | Meter |
| Soil Texture | Type of soil 🟤🟠⚫ | Soil_Texture Triangle |
| Slope | Grades/Percent 📐 | GPS/Inclinometer |
I know! There are a lot of variables and you may say “that´s imposible 😮”. I try to guide you step by step the collections of data.
1.1 How can we collect our data?
We need to capture the data and i know two forms:
Create a survey: You can create a survey and collect all the information, with Survey 123 for ArcGIS or Kobo toolbox. This apps are amazing because you can collect geocode information and both uses xlsform💪.
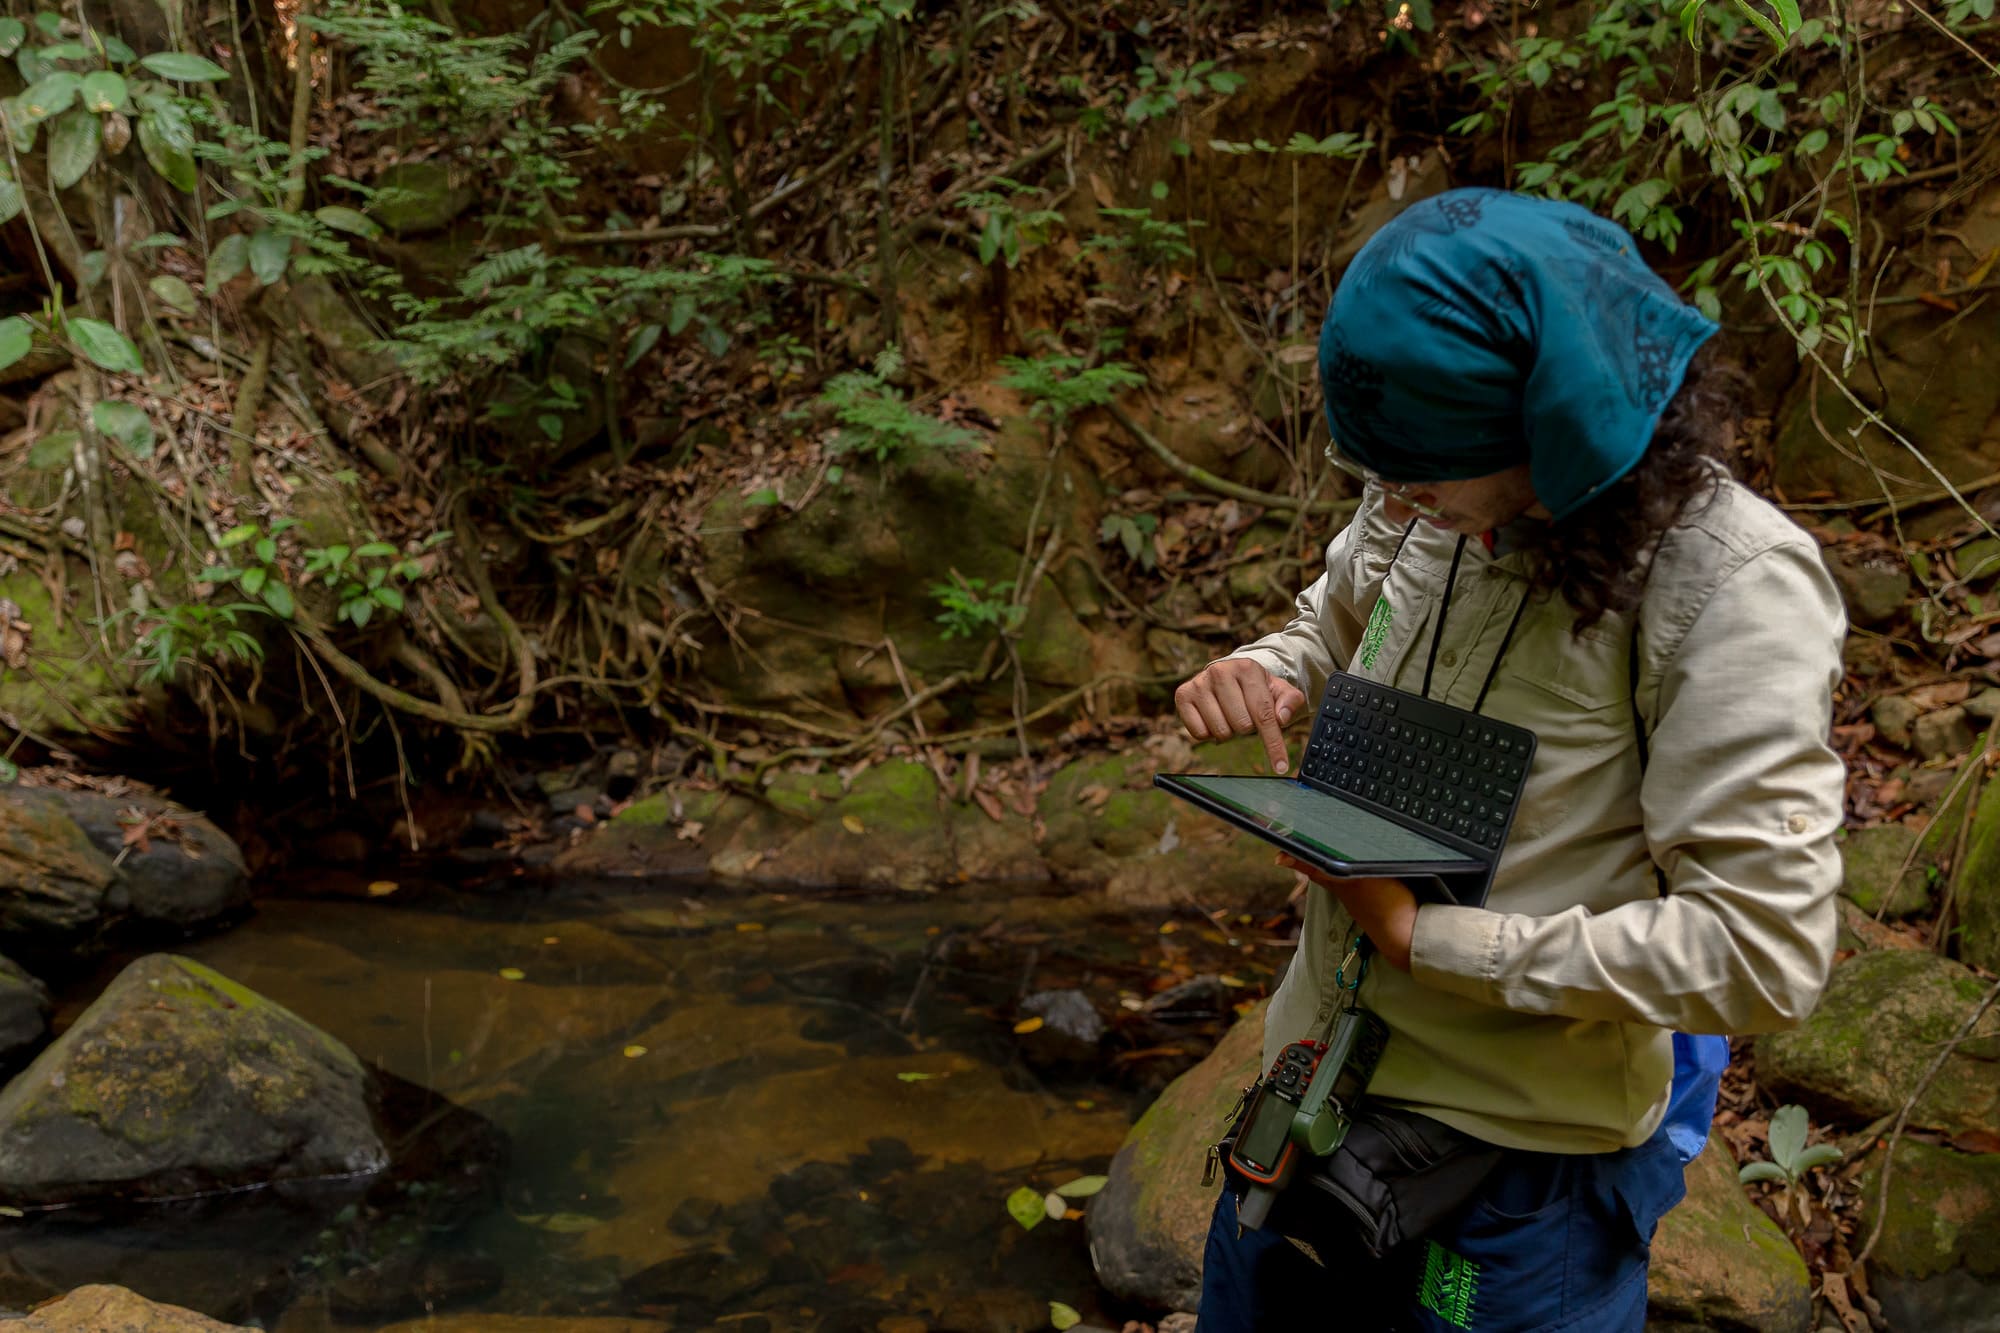
Create you own record sheet: Take your sheet to record the data every 100 - 200 meters. Don’t forget to bring your GPS to record the points 🗺️.
I use Survey 123, and collect each 100 - 200 meters the following variables:
| type | name | description |
|---|---|---|
| dateTime | wsdate | Actual date |
| geopoint | location | Location of point (each 100 - 200 m) |
| text | name_place | Name of place |
| text | section_trail | At what point are we on the total path? (example: 100, 200, 500) |
| calculate | altitute | What altitude are we at? |
| integer | width_cm | What is the width of the path in centimeters? |
| calculate | width_m | The survey calculates meters based on centimeters |
| select_one Tipo_Roca | soil_type | What type of soil are we on at the moment? |
| decimal | slope | What slope does the GPS give you? |
| decimal | erosion | Is there a place that shows erosion? Write it down and measure how many meters/centimeters it is eroded |
| decimal | puddle | Is there a place that has puddles? Write it down and measure how many meters/centimeters the puddle has |
| image | picture | Do you want to register an image of the registered point? Take a photo! |
| text | observation | Do you want to record an observation? Write it down! |
So i share with you the xlsform that i used for collect the data. link
1.2 How can we track our route?
There are two ways for track the routes.
GPS 🌎: This is the best option because they are specifically designed for this purpose. The most common and reliable GPS devices come from brands like Garmin which offer rugged construction and accurate navigation tailored for outdoor activities.
Phone 📳: Using a phone as a GPS device is a convenient option when a dedicated GPS is not available. The best applications for this purpose include Avenza maps and Wikiloc, both of which provide robust features for mapping and tracking your route. They utilize the phone’s built-in GPS to offer a high degree of accuracy and a range of tools to help hikers and trail enthusiasts navigate effectively.
1.3 Let’s start taking points!
You might be wondering why it’s necessary to take measurements every 100 or 200 meters. This is due to the sampling required for each route. Generally, I use every 100 meters as a sample of the trail. However, for longer routes where I find similarities every 100 meters, I opt for the 200-meter measurement. For instance, when I am on roads that have a consistent standard in width, slope, and altitude, I decide to take the 200-meter measurement until I encounter a different pattern. This method ensures that the data collected accurately reflects the trail’s conditions without being too redundant when uniformity is present.
In the illustrations, you can see that I’m carrying the GPS, the device for conducting surveys, and a decameter (useful for long measurements). These three tools are more than sufficient for taking the necessary measurements.
2.How can we measure the carrying capacity?
There are three types of carrying capacity, Physical Carrying Capacity (PCC), Real Carrying Capacity (RCC) and Effective Carrying Capacity (ECC).
2.1 Physical Carrying Capacity (PCC)
It is the maximum limit of visits that can be made to a site with a defined space in a determined period of time (Cifuentes, 1992).
To calculate the actual carrying capacity, the following information must be available: area occupied by each visitor, area of distance between each group, number of visitors in the group including the guide, time required to visit the site, number of hours open to the public an total surface area of the site (Cita).
\(PCC = \frac{S \times NV}{SP}\)
Where:
\(S=\) Available area, in linear meters.
\(SP=\) Area used per person
\(NV =\) Number of times the site can be visited by the same person in one day.
2.2 Real Carrying Capacity (RCC)
It is the maximum limit of visits that can be made to a site with a defined space in a determined period of time (Cifuentes, 1992).
\(RCC = PCC \times (Fc_1 \times Fc_2 \times \ldots \times Fc_n)\)
Where:
\(PCC=\) Physical Carrying Capacity
\(FC = \frac{ 1- M1 \ (limit \ factor)}{Mt \ (Total \ factor)}\)
Correction factors: They are defined as the physical and ecological variables of the site that can negatively affect the physical carrying capacity due to the use of the ecotouristic activity.
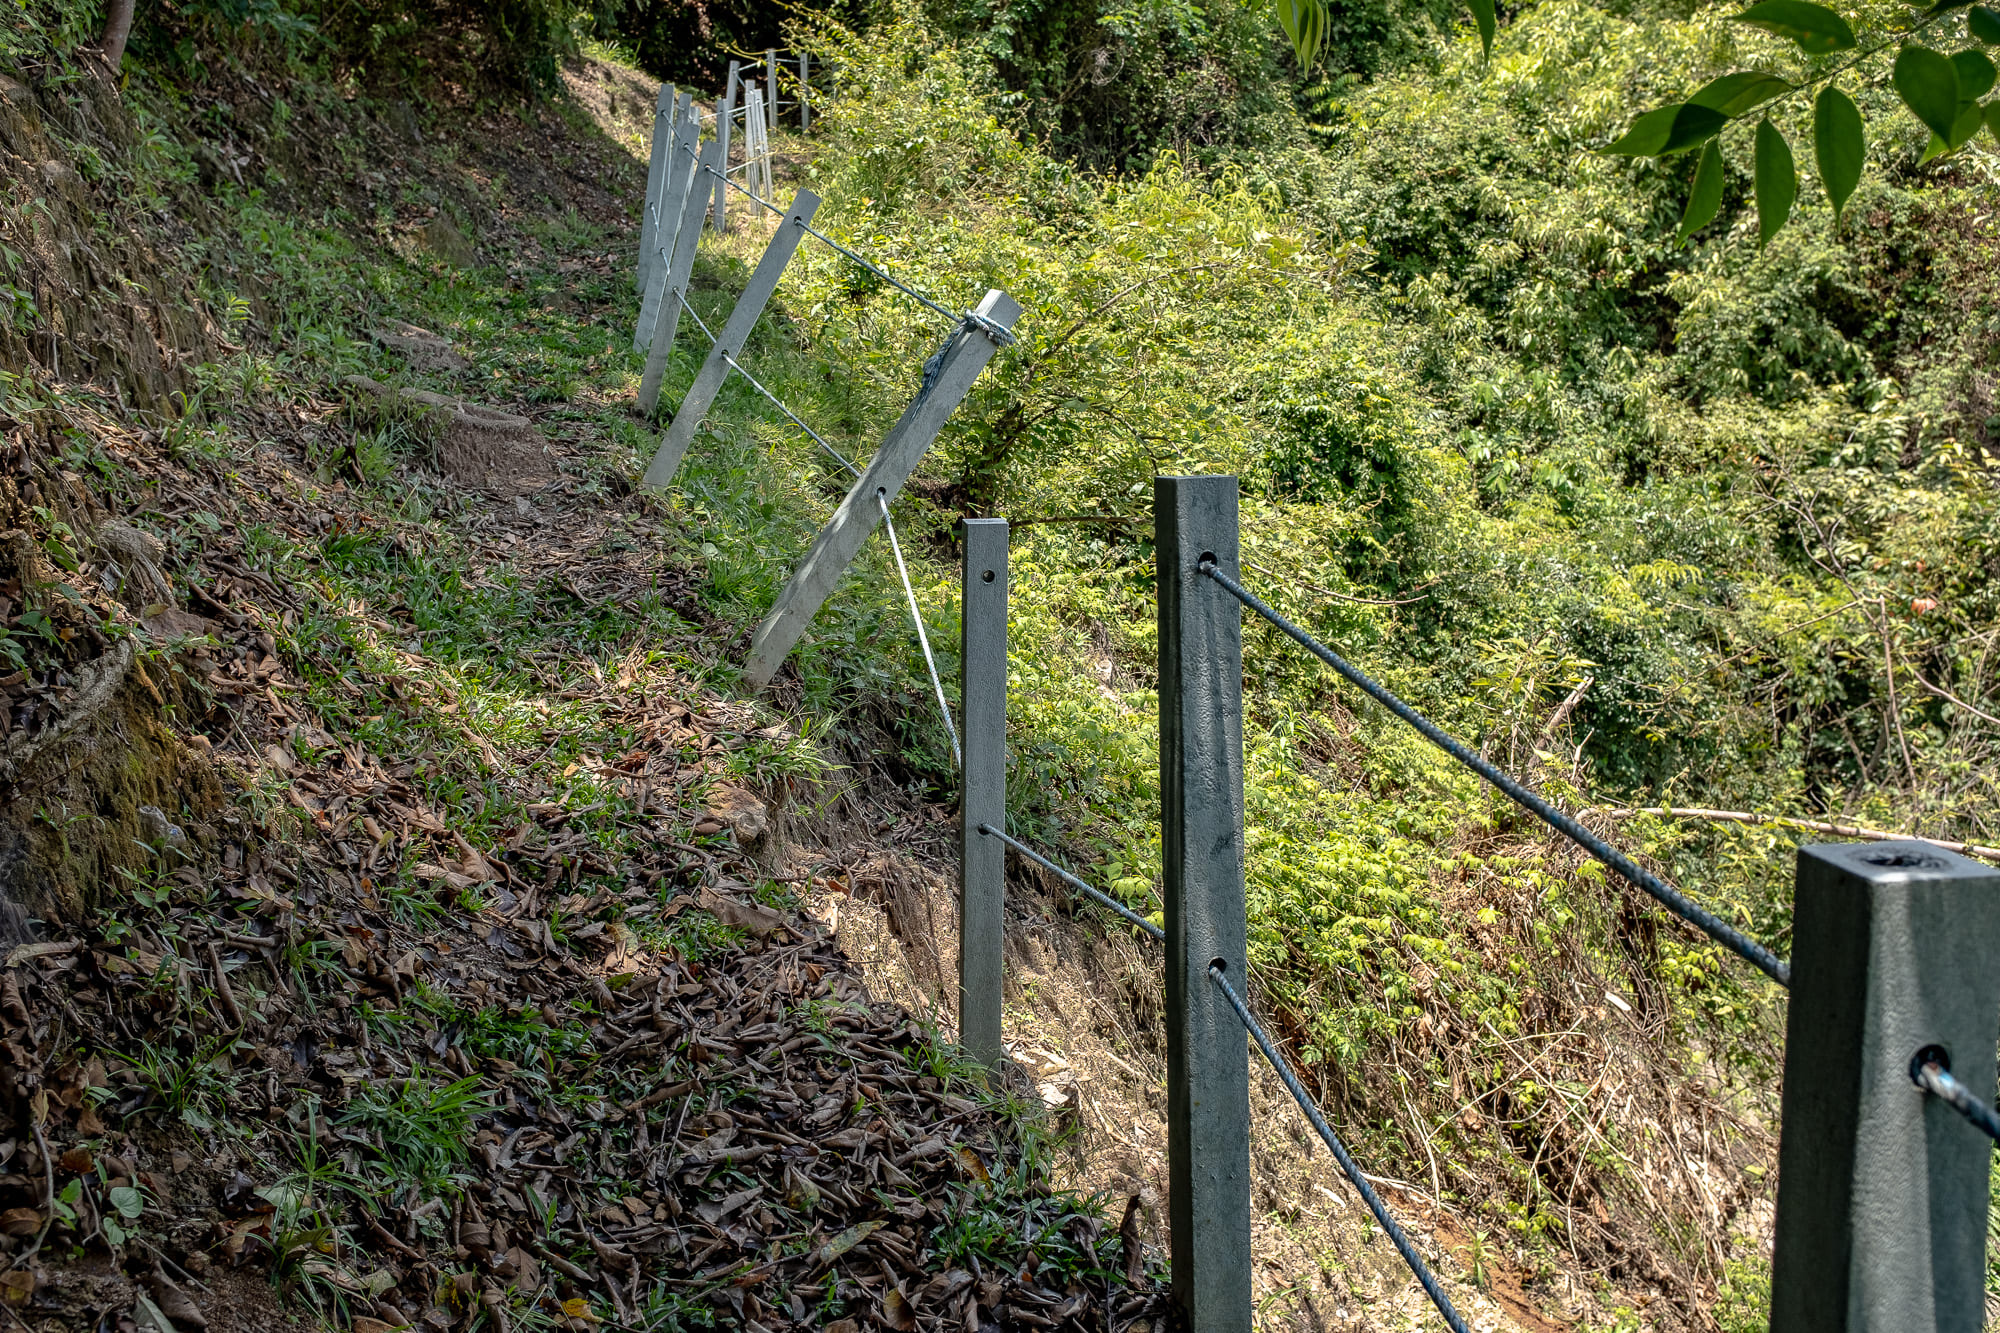
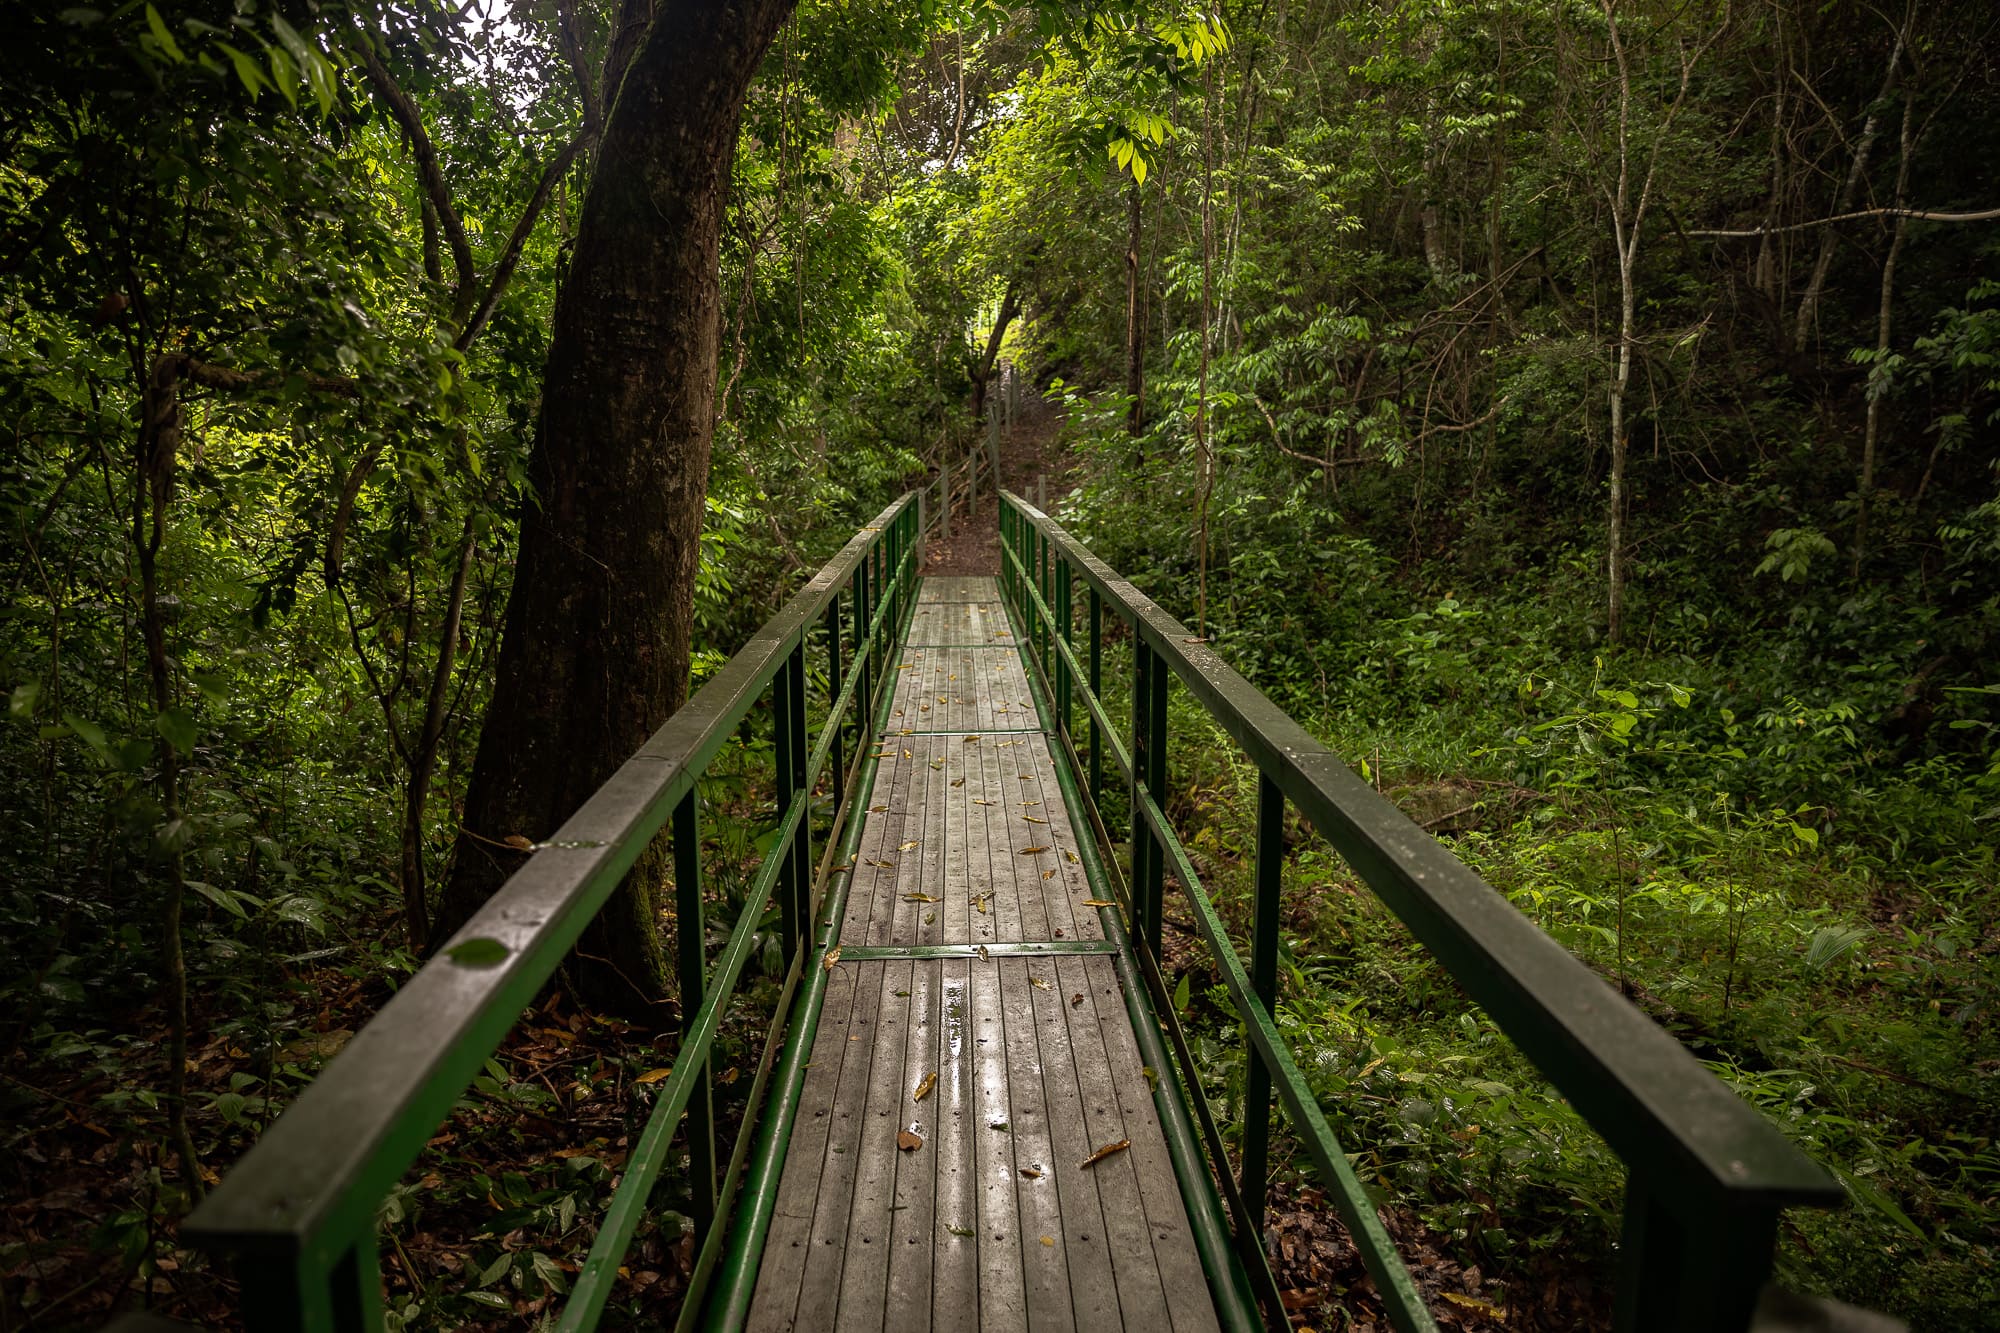
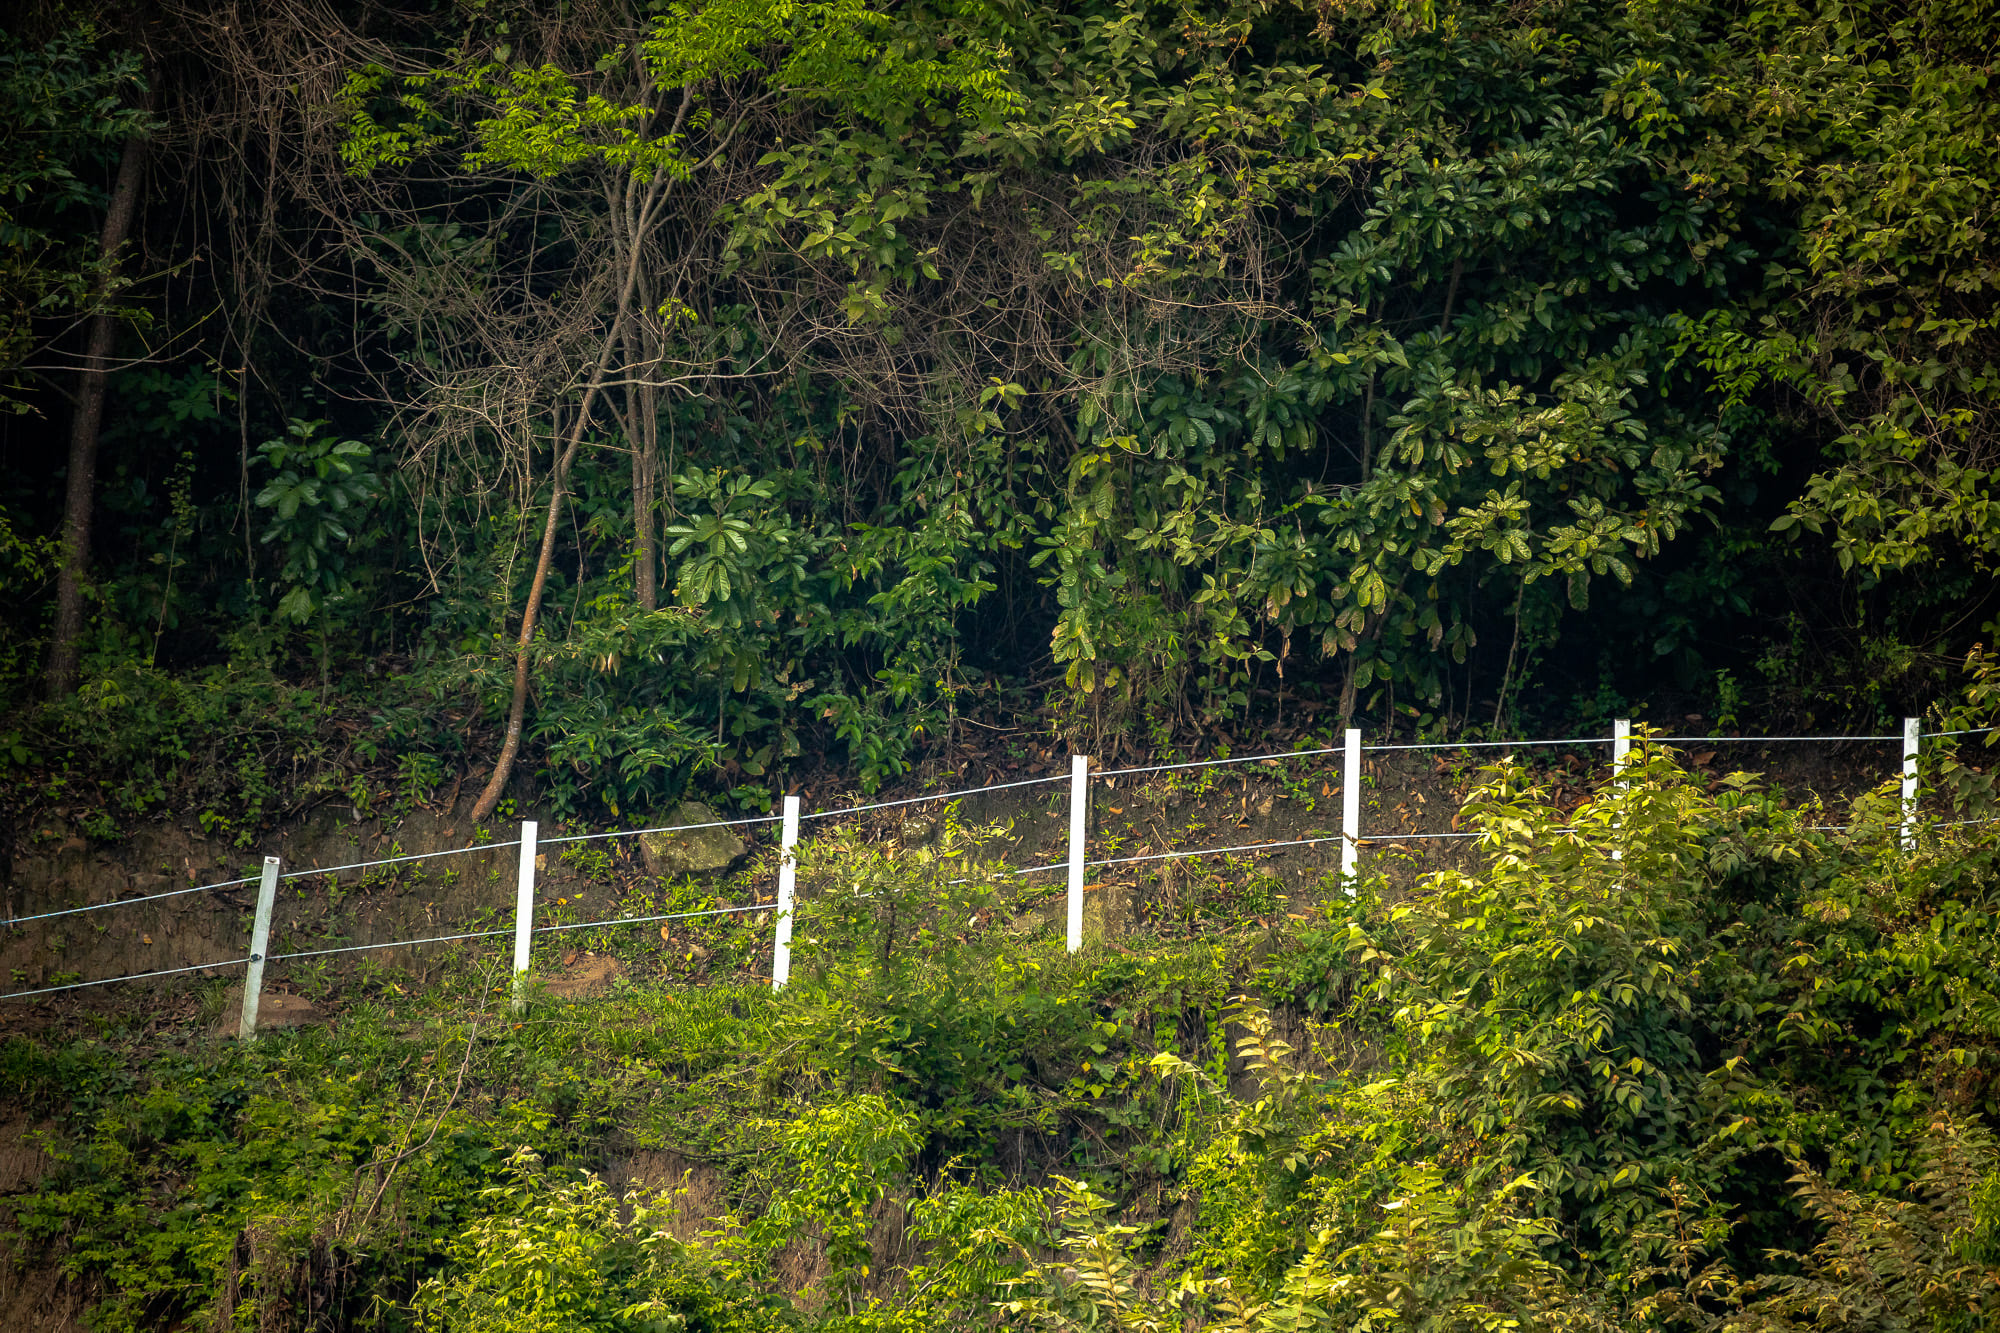
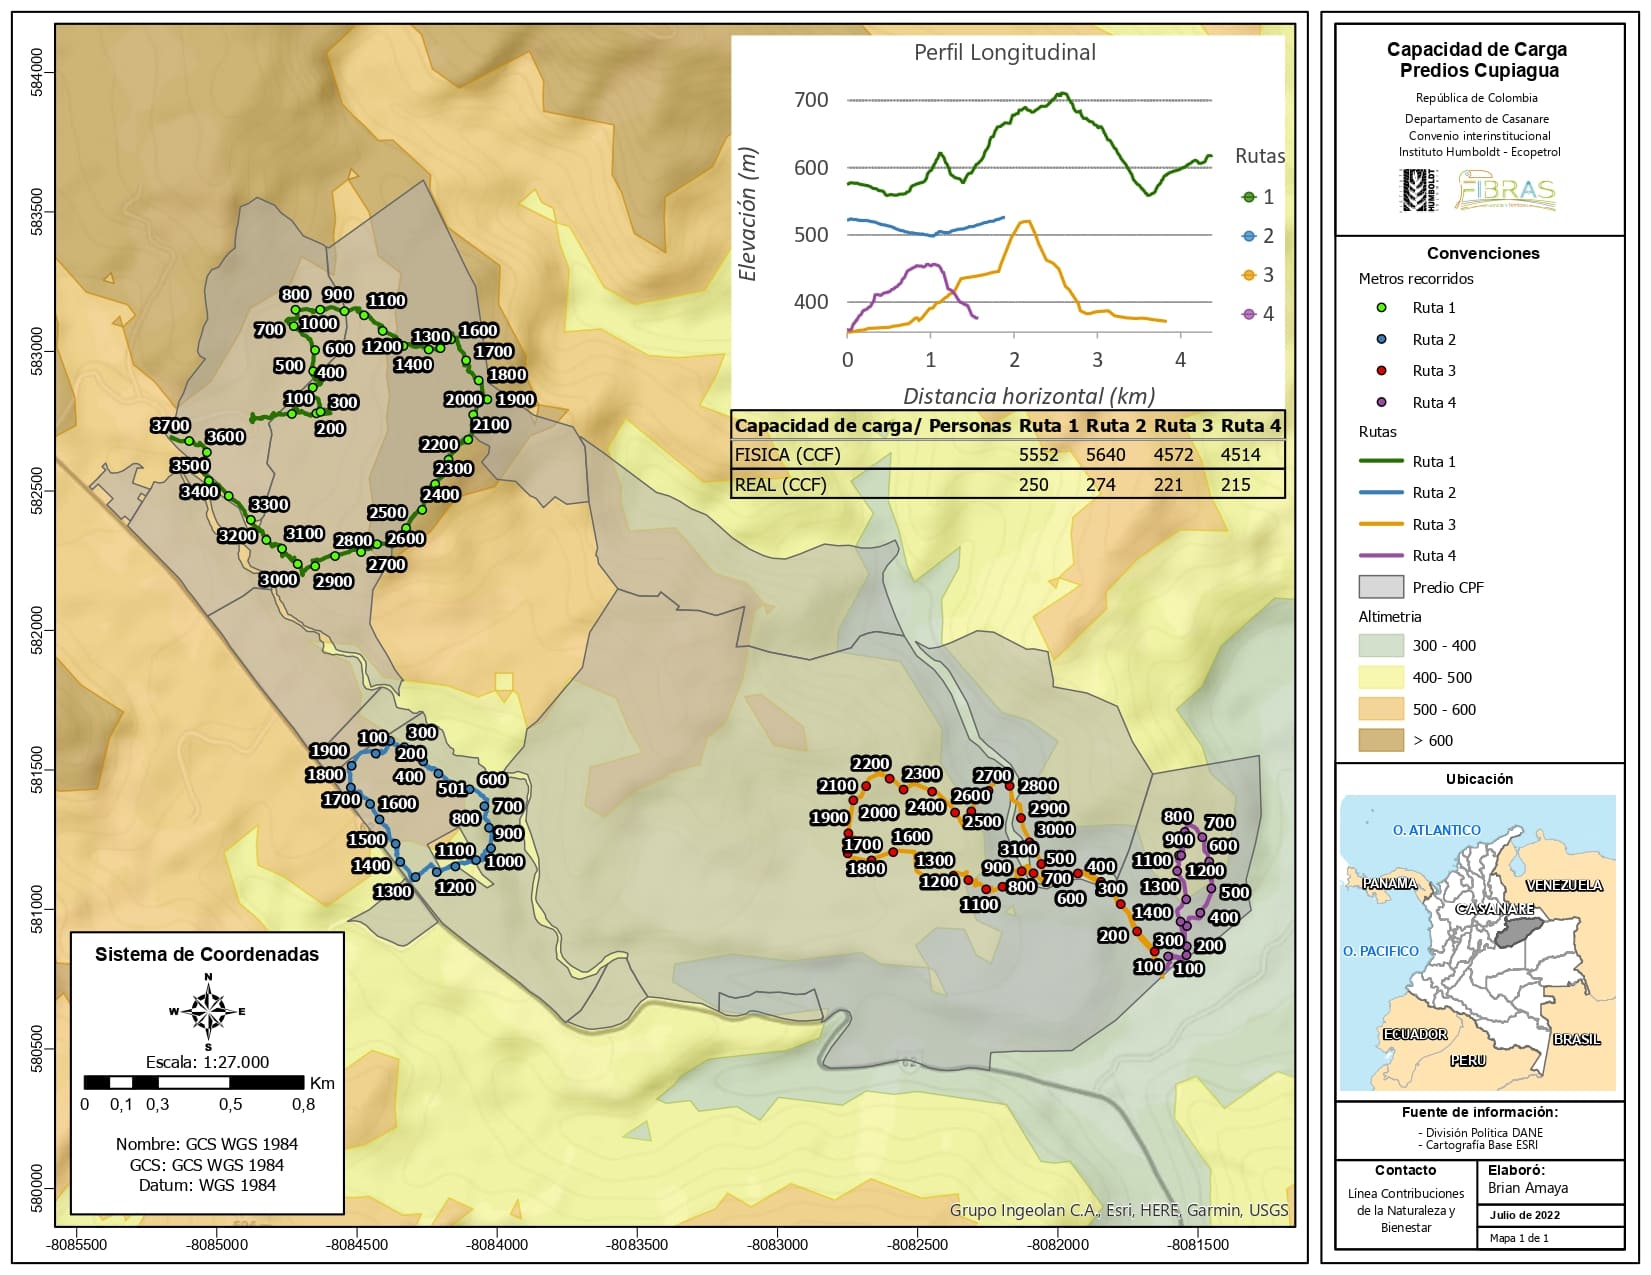
After gathering information on the trail’s coordinates, dimensions (length, width, and height), as well as factors like erosion, gradient, waterlogging, and the placement of structures (such as bridges, barriers, and lookouts), the study, with the assistance of GIS, produces two key outputs: a topographic profile and a schematic of the trail, as depicted.
2.3 Effective Carrying Capacity (ECC)
It is the maximum limit of visits that can be allowed in order to organize and manage them. This stage of carrying capacity assessment is highly beneficial for decision-makers, as it enables them to direct their management efforts towards optimizing variables that aid in managing impacts on natural resources and enhancing the visitor experience.
We need to take into account the equipment, infrastructure, and staff, considering the current quantity versus the optimal quantity of resources. We also need to consider the condition, location, and functionality based on the following table.
| VALUE | CLASIFICATION |
|---|---|
| 0 | Dissatisfied |
| 1 | Not very satisfied |
| 2 | Moderately Satisfied |
| 3 | Satisfied |
| 4 | Very satisfied |
Finally, a visualization can be made to monitor the trails. In this case, a control panel was made for possible tourist routes associated with the FIBRAS project carried out by the Humboldt Institute and Ecopetrol.